


Severe Tropical Cyclone Zelia: Australia's First Category 5 Storm of 2025
Meteorological Evolution
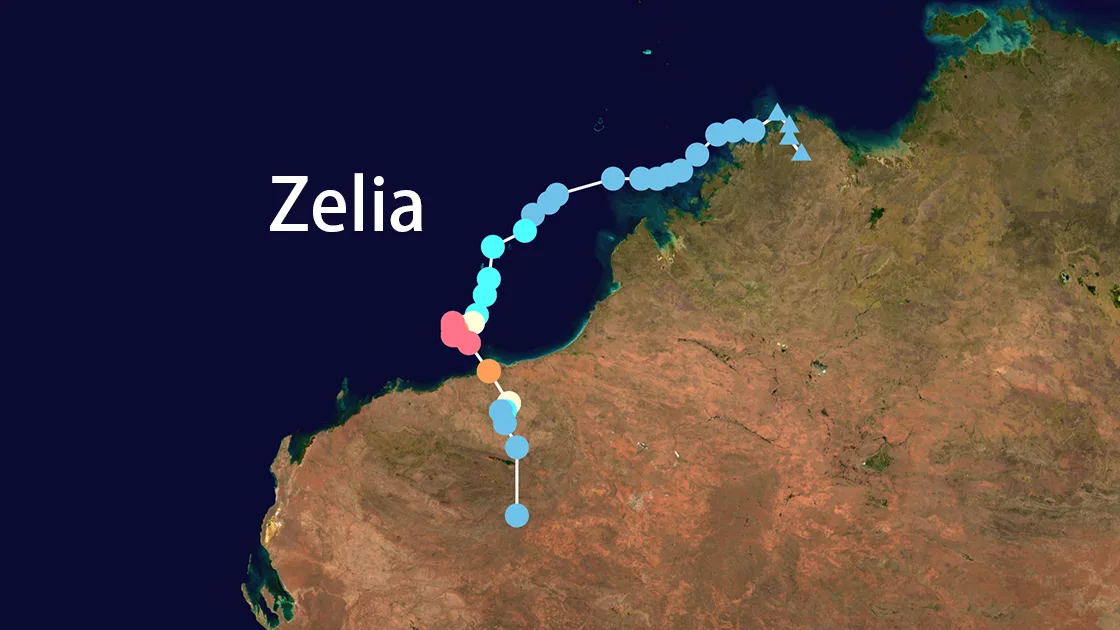
Zelia emerged as Tropical Low 18U near Western Australia's Kimberley region on 7 February 2025. The system initially tracked west-southwest with limited development until 11 February when deep convection organized around its center.[^1]
Rapid Intensification Timeline:
- 11 Feb 06:00 UTC: Upgraded to Category 1 (BoM)
- 12 Feb 06:00 UTC: Reached Category 2 status
- 13 Feb 00:00 UTC: Intensified to Category 4
- 13 Feb 06:00 UTC: Achieved Category 5 status[^2]
- 14 Feb 04:30 UTC: Made landfall near De Grey (20.2°S 119.1°E) with 205 km/h winds[^3]
Landfall Characteristics
Zelia struck Australia's Pilbara coast as a compact but powerful system:
- Peak Intensity: 927 hPa pressure with 205 km/h sustained winds
- Storm Surge: 4.2 meters recorded at Port Hedland
- Rainfall: 300mm/24h at Marble Bar station[^4]
Impact Analysis
Infrastructure Damage:
- Port Hedland (world's largest iron ore terminal) closed for 72+ hours
- 124 structures damaged in South Hedland
- 19,000 homes lost power
Economic Consequences:
| Sector | Impact | Duration |
|---|---|---|
| Mining | $1.2B production loss | 5-day shutdown |
| Shipping | 47 vessels delayed | 4-day backlog |
| Agriculture | 12,000 livestock losses | N/A |
Emergency Response
Western Australia's DFES implemented:
- 2 evacuation centers (Port Hedland & Karratha)
- 117 swiftwater rescue teams deployed
- Satellite emergency communication systems activated
Climate Context
Zelia's rapid intensification (RI) pattern:
- 24h Pressure Drop: 54 hPa (13-14 Feb)
- Sea Surface Temp: 31°C (+2.5°C above average)[^5]
- RI Factor: 95th percentile for Australian cyclones
Post-Storm Recovery
Key rehabilitation efforts:
- Debris clearance from 380km of roads
- Temporary housing for 124 displaced families
- Mental health support programs for 2,400 residents
Conclusion
Cyclone Zelia demonstrated the increasing threat of rapid-onset storms in warming oceans. Its compact structure (150km eye wall) and extreme winds caused concentrated damage, highlighting needs for:
- Enhanced building codes in NW Australia
- Real-time microweather monitoring systems
- Climate-adaptive port infrastructure
[^1]: Bureau of Meteorology (BoM) Tropical Cyclone Report 2025-04
[^2]: Joint Typhoon Warning Center (JTWC) Advisory 17P
[^3]: ABC Emergency Live Updates 14/02/2025
[^4]: WA Department of Primary Industries Report
[^5]: CSIRO Marine Temperature Analysis