

Typhoon Podul (2025): Dual Landfalls Unleash Catastrophic Flooding Across Southeast Asia
Meteorological Profile: The "Bullet Typhoon" Phenomenon
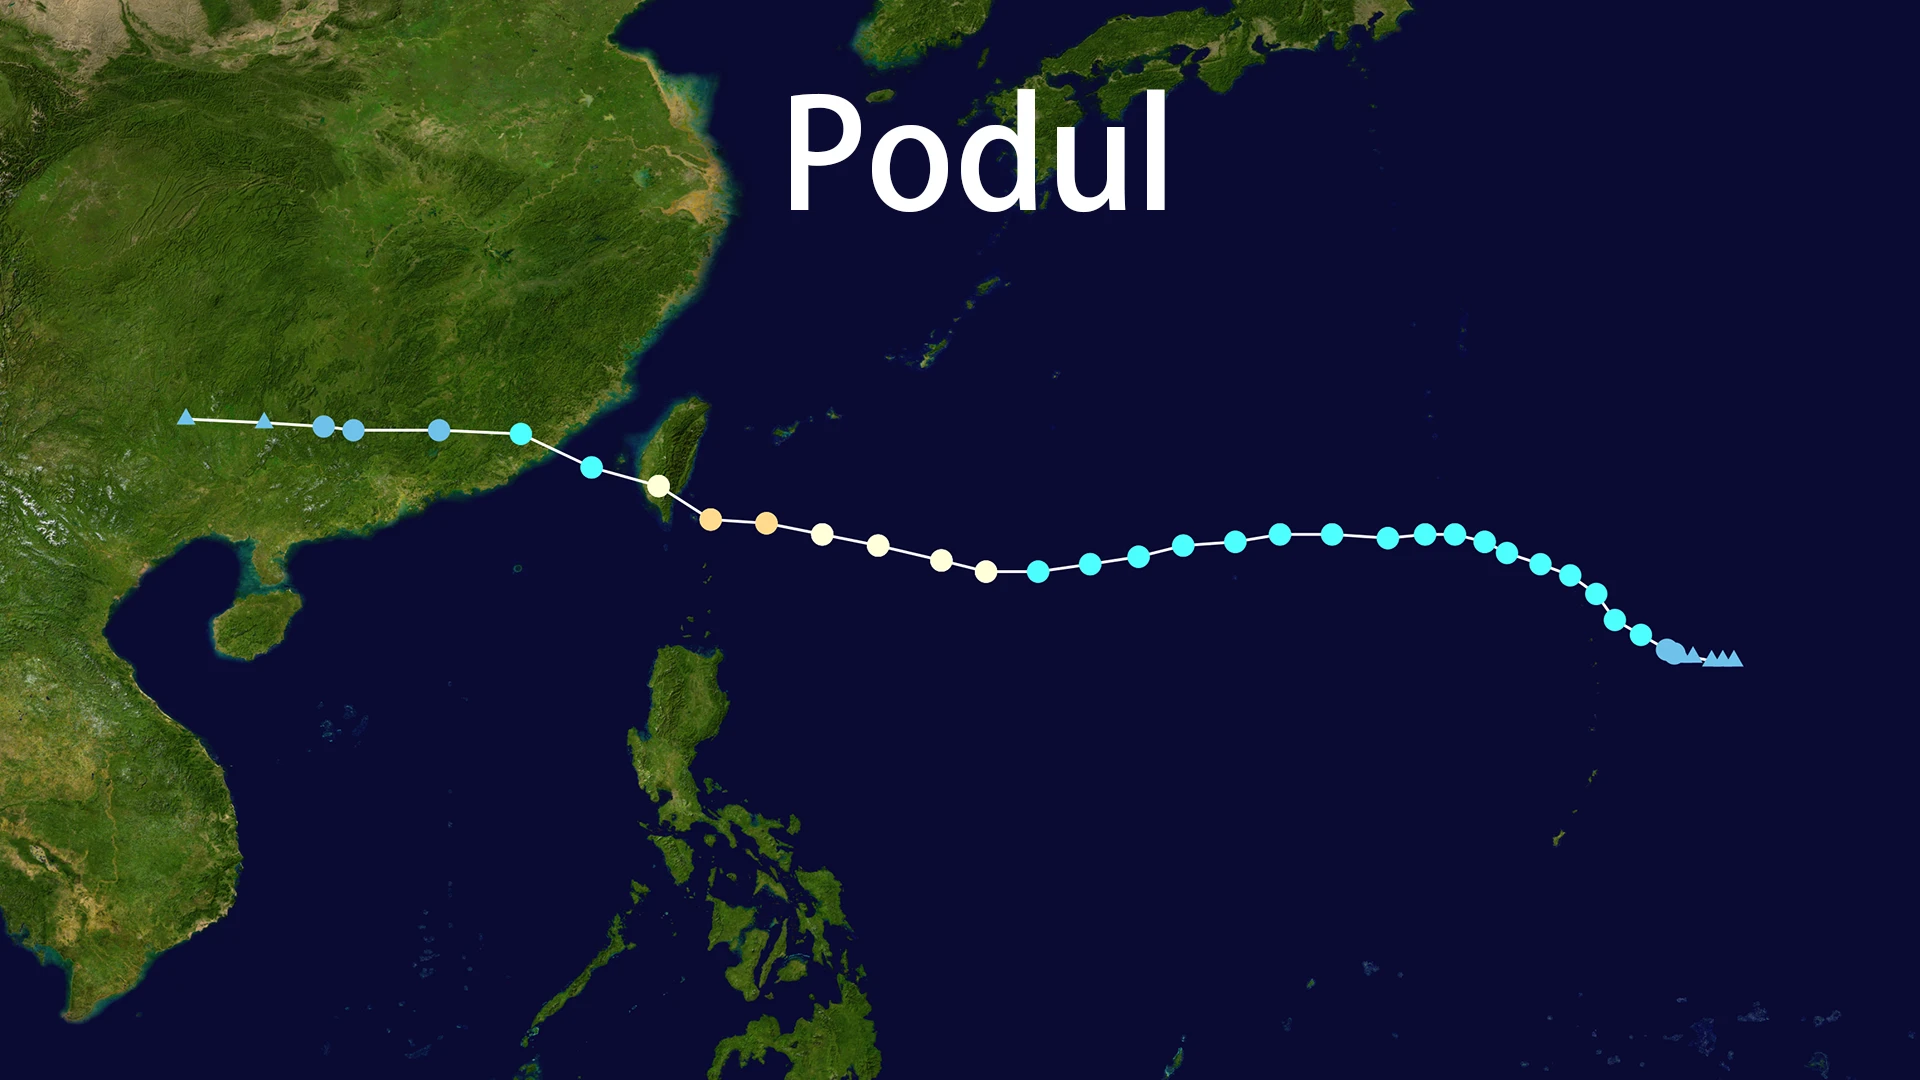
Born on August 6, 2025, over the Northwest Pacific, Typhoon Podul (locally named Yangliu in Taiwan, Gorio in the Philippines) defied conventional intensification patterns:
August 9: Explosive strengthening to Category 2 typhoon (158 km/h winds)
August 13, 13:00 local: Slammed into Taitung County, Taiwan with 14-level intensity (42 m/s sustained winds, 191 km/h gusts)
August 14, 00:30: Second landfall at Gulei, Fujian, China as a weakening tropical storm
Core Feature: Compact 120-km diameter enabling 36 km/h westward acceleration – faster than 93% of NW Pacific typhoons
Catastrophe by the Numbers: Where Science Meets Disaster
Typhoon Podul's legacy lies in its record-shattering metrics:
Parameter Measurement Impact Zone
Peak Wind Gusts 220 km/h (Beaufort 17) Lanyu Island
Minimum Pressure 960 hPa Taiwan Strait
Max 24-hr Rainfall 656 mm Dashan Mountain, Pingtung
Guangdong Precipitation 622.6 mm (300% of avg) Pearl River Delta
Agricultural Losses NT$355.4 million Taitung County
Taiwan Impact: The Hidden Economic Cataclysm
Despite official claims of "no major structural damage," Typhoon Podul exposed systemic vulnerabilities:
Agricultural Collapse: 2,218 hectares of sugar apples destroyed in Taitung – equivalent to 25% of Taiwan’s annual production
Energy Grid Failure: 310,000 households plunged into darkness; 6,000 in Tainan remained powerless for >48 hours
Human Toll: 112 injuries + 1 missing fisherman swept away despite evacuation orders
Infrastructure Paradox: Concrete towers stood firm while landslides severed 5 critical highways
"The real damage wasn’t in collapsed buildings, but in paralyzed supply chains and traumatized farming communities." – Dr. Chen Wei, National Taiwan University Disaster Research Center
Mainland China Crisis: When Rainfall Became Weaponized
Typhoon Podul's second act proved deadlier through hydrological warfare:
Mass Evacuations: 75,000 evacuated in Guangdong alone; 15,000 coastal residents relocated in Fujian
Economic Cardiac Arrest:
Quanzhou’s manufacturing hub paralyzed (33% flights canceled)
Textile export losses exceeding ¥430 million
Urban Drowning: Hong Kong’s Black Rainstorm Warning halted courts, schools, and transit systems
Climate Amplification: Pre-saturated soils from July monsoons triggered compound flooding across 6 provinces
The Riddle of "Peak Intensity": Why Podul Wasn’t the Worst
Comparative analysis with historical cyclones reveals a counterintuitive truth:
Typhoon Peak Category Fatalities Economic Loss Critical Factor
Podul (2025) Cat 2 0 / 1 missing $119M (agri) Rapid transit (36 km/h)
Nepartak (2016) Cat 5 111 $1.89B 12-hour stall over Taiwan
Krathon (2024) Cat 4 18 $48.1M Western plain inundation
The Podul Paradox: Maximum wind speeds ≠ maximum destruction. Landfall location, translational velocity, and pre-existing vulnerability dominated outcomes.
Climate Connections: ENSO’s Deadly Dance
Typhoon Podul emerged during a critical climate transition:
La Niña → ENSO-neutral shift pushed cyclone genesis 200km eastward
Micro-typhoon prevalence increased by 40% vs. 2000-2020 average
Projected trend: Compact, fast-moving typhoons to rise 25% by 2030 under RCP8.5 scenario
"Podul is a preview of coming attractions: smaller eyes, faster intensification, and rain bombs overwhelming drainage systems." – Prof. Kenji Nakamura, IPCC AR7 Lead Author
The Unlearned Lessons: Policy Gaps in Plain Sight
Three systemic failures amplified Podul’s damage:
Disaster Communication: Taiwan’s "no major damage" declaration obscured $119M agricultural losses
Coastal Governance: 28-year-old fisherman’s death exposed unenforced fishing bans
Cumulative Vulnerability: Taitung farmers devastated by back-to-back July floods + August typhoon
The Imperative: Integrate translational velocity metrics into evacuation protocols and redesign flood control for 600mm/24hr rainfall events.